archived / shipped / access: public
IBD Incidence Dashboard
An interactive map and report built with a gastroenterologist to explore pediatric IBD incidence across Czechia and support a journal paper.
- span
- 2025
- role
- research collaborator · data/visualization developer
- audience
Context
This started as a small collab with a gastroenterologist from a local university hospital who tried to gather retrospective data on Inflammatory Bowel Disease in a pediatric population from other hospitals in Czechia and wanted a way to visualize the anonymized dataset by geographic region.
The anonymization part proved to be tricky, as the instances were coded against PSČ (postal codes), which do not have a clear mapping onto administrative regions. Especially with the intended granularity reaching individual municipalities, we needed to come up with a creative compromise by utilizing probabilistic PSČ-to-municipality allocation.
What I Built
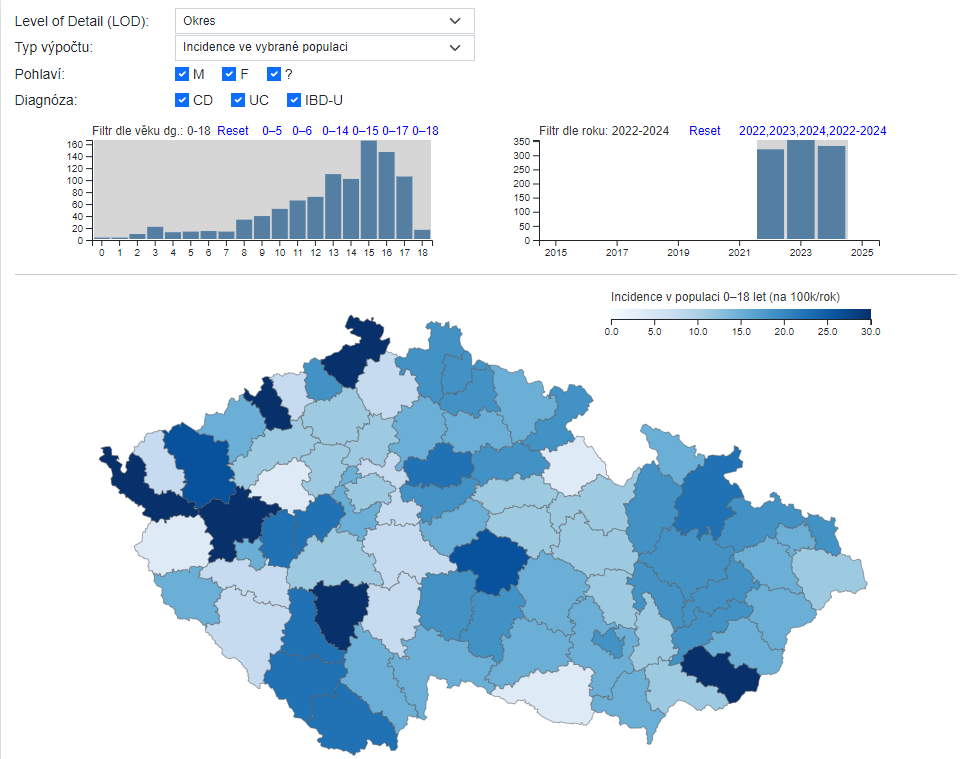
We ended up with a single-page dynamic report visualization utilizing the D3.js framework. The cross-filter logic of the report was custom-made to fit the use case, enabling it to display the choropleth at six different levels of granularity with filters for sex, exact diagnosis, age range, and diagnosis year. The report includes sortable tables with results that can be exported.
Most of the analytics and preprocessing was done in the Python pipeline. On-demand calculations based on filters are done in the browser via D3.js. The pipeline utilized various sources to make the project work:
- A list of IBD cases with PSČ as the location identifier.
- Population data from the Czech Statistical Office (ČSÚ). Based on the level of detail, we got different granularities of aggregates — total population by sex at the municipality LoD; population by age and sex at the municipality-with-extended-powers LoD; and population in age groups (0–5, 0–6, 0–14, 0–17, 0–18) by sex at the municipality LoD.
- A list of physical addresses in municipalities from RÚIAN (link) containing both PSČ and the municipality code for each address.
- A shapefile of administrative regions and municipalities from RÚIAN (link).
- A description of the hierarchy for the LoD used in the visualization from RÚIAN (link).
The denominator changes with the selected cohort. The frontend calculates annual incidence as weighted cases ÷ matching population ÷ selected years × 100,000, including sex- and age-specific population slices.
The project ended up supporting a journal paper about the incidence, prevalence, and trends of IBD in Czechia by providing exported tables and figures.
Interesting Problems
Converting PSČ to administrative districts
The main issue was mapping individual cases onto the shapes in the choropleth map. PSČ were gathered as part of the pseudonymization effort to avoid storing the direct address, and it was infeasible to retroactively seek other info, as there were ~1000 cases across 23 nationwide departments. At the same time, users wanted to have a regional overview based on the commonly known shapes of municipalities, districts, etc.
There is a true M:N relation between municipalities and PSČ. Plzeň uses 10 different codes, for example, while some codes, such as 33011, serve 10 municipalities. Some codes are even split between multiple districts or regions.
I decided to utilize a list of addresses in individual municipalities to tally the counts per PSČ. This way I could establish a ratio to split each PSČ case into multiple areas by. This meant I was basically working with probabilities that the case would fall into a given area — e.g. a case in 33011 was considered to have a 0.46 probability of originating in Třemošná, 0.21 in Hromnice, etc.
This produced artifacts such as decimal numbers of cases per district, but it was a pragmatic approximation to draw the situation as close to reality as possible.
Simplification of the border shape
The original shapefiles had way greater precision than was needed for a choropleth chart on the web. Apart from being superfluous, this would also cause a significant performance hit for the user when the geometry needed to be downloaded from the web server and when it needed to be rendered.
To solve the issue, a tool in QGIS was used to systematically simplify the area polygons by removing unnecessary vertices while keeping the basic shape similar. This reduced the size of the geometry from the original ~600 MB down to 23.8 MB in total (with the most detailed LoD being a 21.1 MB geometry file covering 6,258 municipalities). The geometries are downloaded on demand and cached, so it is possible that a user only ever needs to download a few MB of data.
Making the datasets agree
Several data-quality guardrails needed to be implemented in the preprocessing so the results could be trusted and utilized. These include corrections for malformed PSČ values; checks for negative or inconsistent ages, complete PSČ coverage, and uniqueness of municipality mappings; Prague-specific hierarchy handling; and assertions that male + female population totals reconcile.
Related projects
- University Course Materials — part of this project was utilized as a complex example in the DBM1 course to demonstrate advanced preprocessing and deriving secondary features from data sources.