archived / shipped / access: public
RDF Explorer
A tool for exploring unfamiliar RDF datasets and turning their observed structure into something closer to an ER diagram.
- span
- 2021-2024
- role
- solo developer · educator
- audience
Context
I work with Resource Description Framework (and SPARQL querying) quite often. We use it in a research project at the university as a base format for the internal data lake. I also teach it in several university courses, and I foolishly decided to run my longest-running hobby projects on it (because I wanted to better understand the technology and its capabilities). However, I have learned that it is by no means easy for a student or collaborator to quickly grasp the concept and utilize data stored in this way.
This project was an attempt to craft a tool that would help users ease into the RDF/SPARQL environment.
What I Built
Initially, the project started as a collection of analytical SPARQL queries with the goal of mapping out an unknown graph and providing a tangible overview to a user trying to explore the data at hand. The queries try to introspect the dataset and summarize which RDF types are commonly used, which properties are frequently associated with instances of a given type, how many distinct values there are, and what the observed cardinalities of properties are. I was heavily inspired by ER diagrams of classic relational databases (ex), which students were often familiar with.
The tool profiles the observed structure of existing data. It does not read a formal schema or authoritative ontology constraints. I think this is more in line with messy, live dataset exploration, which is the main intended use case and seems heavily underdeveloped in existing apps, as they usually work with ontologies and validations against them.
After that, the project turned into a prototype full-stack tool with a Java backend for graph introspection and data serving and a React frontend for visualization and interactive exploration of the findings. The frontend offered a dynamic table of graphs on the given endpoint, lists of frequently used RDF types and properties, a sample instance of a chosen type that could be quickly regenerated, and a diagram capturing relationships between types.
The prototype was primarily offered to students for use in their RDF-based seminar projects. A few commented that it helped them finally understand what they were actually constructing in the RDF/Turtle data files and offered them a holistic view of their data.
The project is unfortunately limited in the scope it can meaningfully tackle. Although it accepts any SPARQL endpoint as input, visualizing and processing rich datasets such as DBpedia quickly exceeds what the current approach can handle. While it is possible to visualize RDF data from my hobby projects, the tool remains mostly an educational prototype, and it would need a major overhaul to be usable on complex datasets.
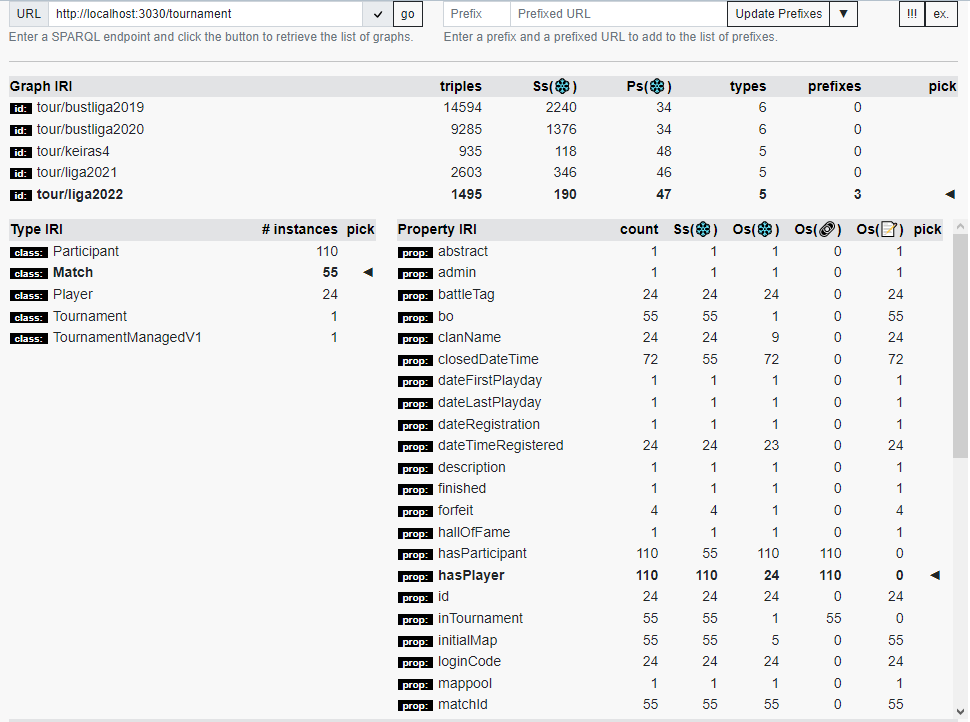
Ss(❄️) = unique subject content;
Ps(❄️) = unique property content;
Os(❄️) = unique object content;
Os(🔗) = # of objects as RDF resources;
Os(📝) = # of objects as literals;
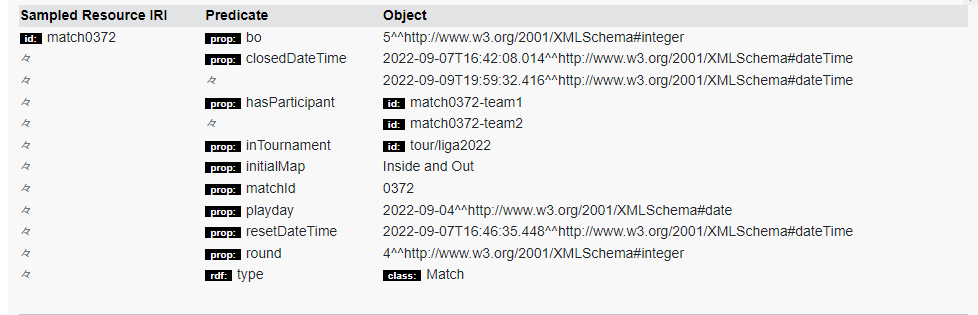
prop:closedDateTime on the sampled instance. Dynamic prefixes are shown in the black boxes to shorten the output.
々 = repetition of the value in the table cell above.
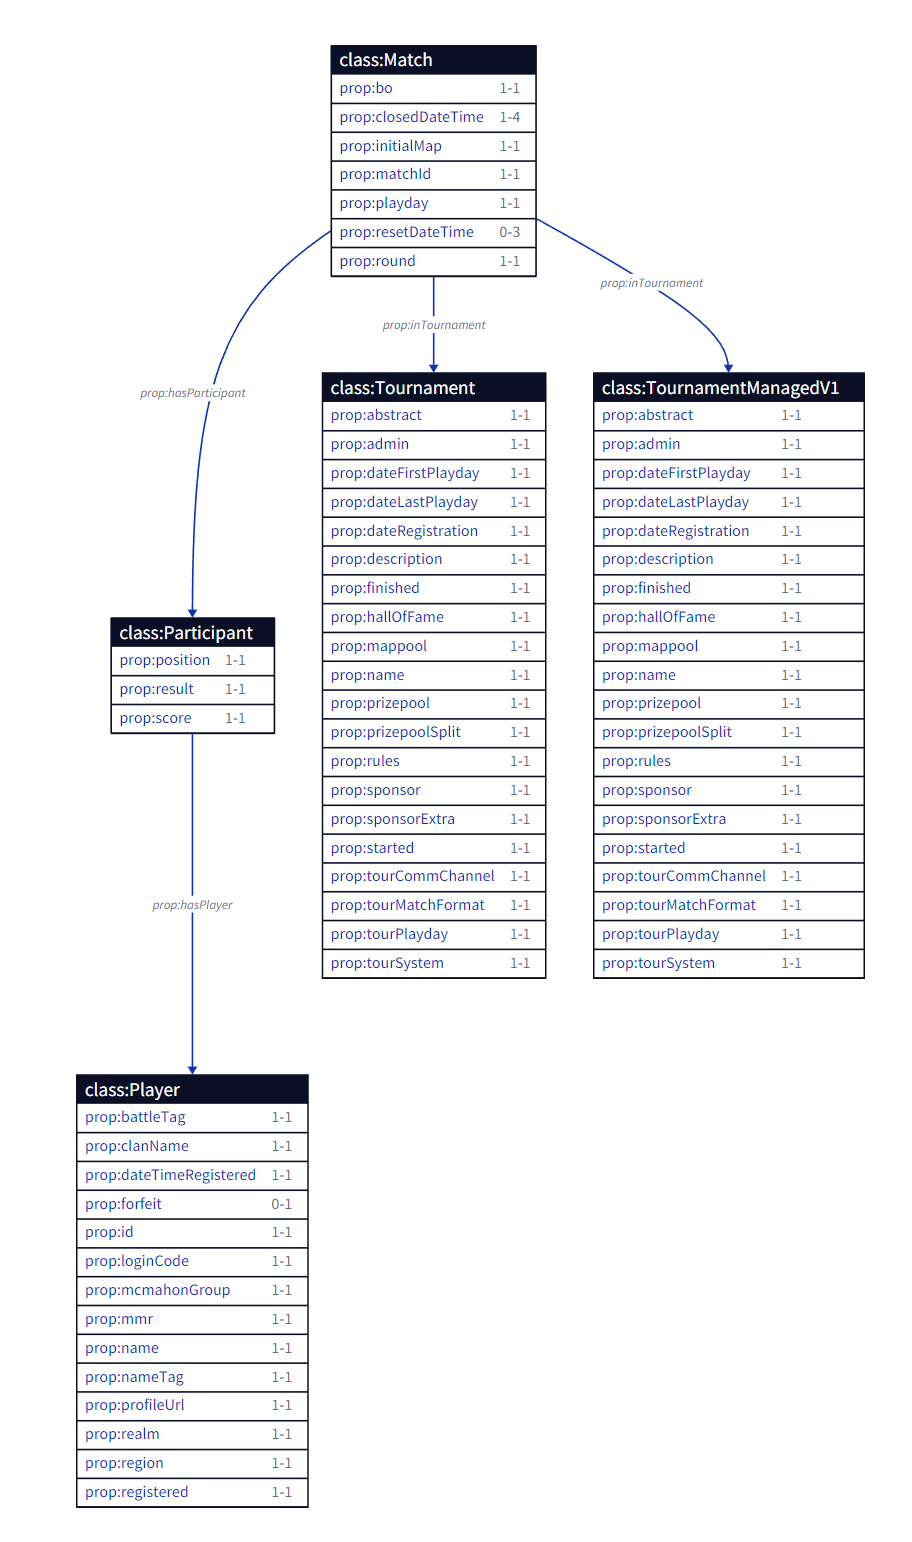
class:Tournament and class:TournamentManagedV1 causes the visual to be bloated, as the tables would ideally merge into a single graphical object.Interesting Problems
Scaling the queries to avoid overloading or timing out endpoints
The ideal query that would gather all the statistics is computationally expensive, especially when trying to estimate the cardinalities of properties. Even when applied to the relatively simple but large graph in Jena Fuseki with SC2 leaderboard data from SC2 Tour System, I would hit query timeouts. When I experimented on our academic data lake running on Virtuoso, I actually managed to repeatedly brick the server, which then had to be restarted manually.
The exploratory and analytical run thus needed to be split into a series of smaller queries that would eventually produce the needed aggregate results. The important tradeoff is that the query was replaced with many sequential queries whose number grows with the types and properties in the graph.
The tool first discovers the default and named graphs together with their prefixes. After the user selects a graph, it gathers the basic statistics, types, untyped resources, and commonly used properties. Relationships and observed cardinalities are then calculated separately for each type and property before the resulting profile is converted into a GraphViz or D2 diagram.
Approachability of RDF data
I noticed an interesting phenomenon when teaching practical sessions for a NoSQL database course. Students usually understood XML/XQuery, JSON data stored and queried via MongoDB, and graph data in Neo4j quite intuitively, but for some reason RDF and SPARQL were hard for them to grasp. We even extended the number of sessions allocated to RDF in the hope that they might need a bit more hands-on time, but to no avail.
I had quite a lot of side conversations about this with both academics and students, but we didn't really manage to label a concrete issue or find an approach to better demonstrate the concept. After using this prototype, which enabled us to present the graph as something known to them (ER modeling) and allowed students to quickly get samples of resource nodes and their properties, a few students mentioned that it suddenly clicked for them and RDF was no longer something scary and unknown.
Random sampling of data
Selecting a random example became a bit more complicated than expected. I quickly noticed that the initial solution behaved a bit "weirdly", so I dug into the rabbit hole and tried three SPARQL approaches:
using a random offset generated in Java code; ordering directly by RAND(); and binding a random sort key before selecting a resource. I ran each version 10,000 times and compared the resulting frequencies with a chi-squared uniformity test. ORDER BY RAND() failed the uniformity check. I eventually settled on BIND(RAND() AS ?sortKey) and ORDER BY ?sortKey to avoid repeatedly showing the same few resources all over again.
Implementation notes
Resources without an rdf:type are counted and exposed as their own group rather than silently disappearing.
Namespace prefixes are extracted from the graph and can be overridden in the UI, making IRIs more readable.
Related projects
Some of my other projects rely on RDF as a data backend. It was initially selected to help me better familiarize myself with the format and later stayed because the refactoring costs were too high.
- RTS Data Manager usually converts the crawled JSON leaderboard data to RDF and stores it in a Jena Fuseki SPARQL server.
- SC2 Tour System uses Jena Fuseki as the primary production database. Later extensions of the project to other games utilize a PostgreSQL relational database instead to move away from the experimental setup.
- SC2 Enemy Info also uses Jena Fuseki and RDF data for player notes storage and lookup.